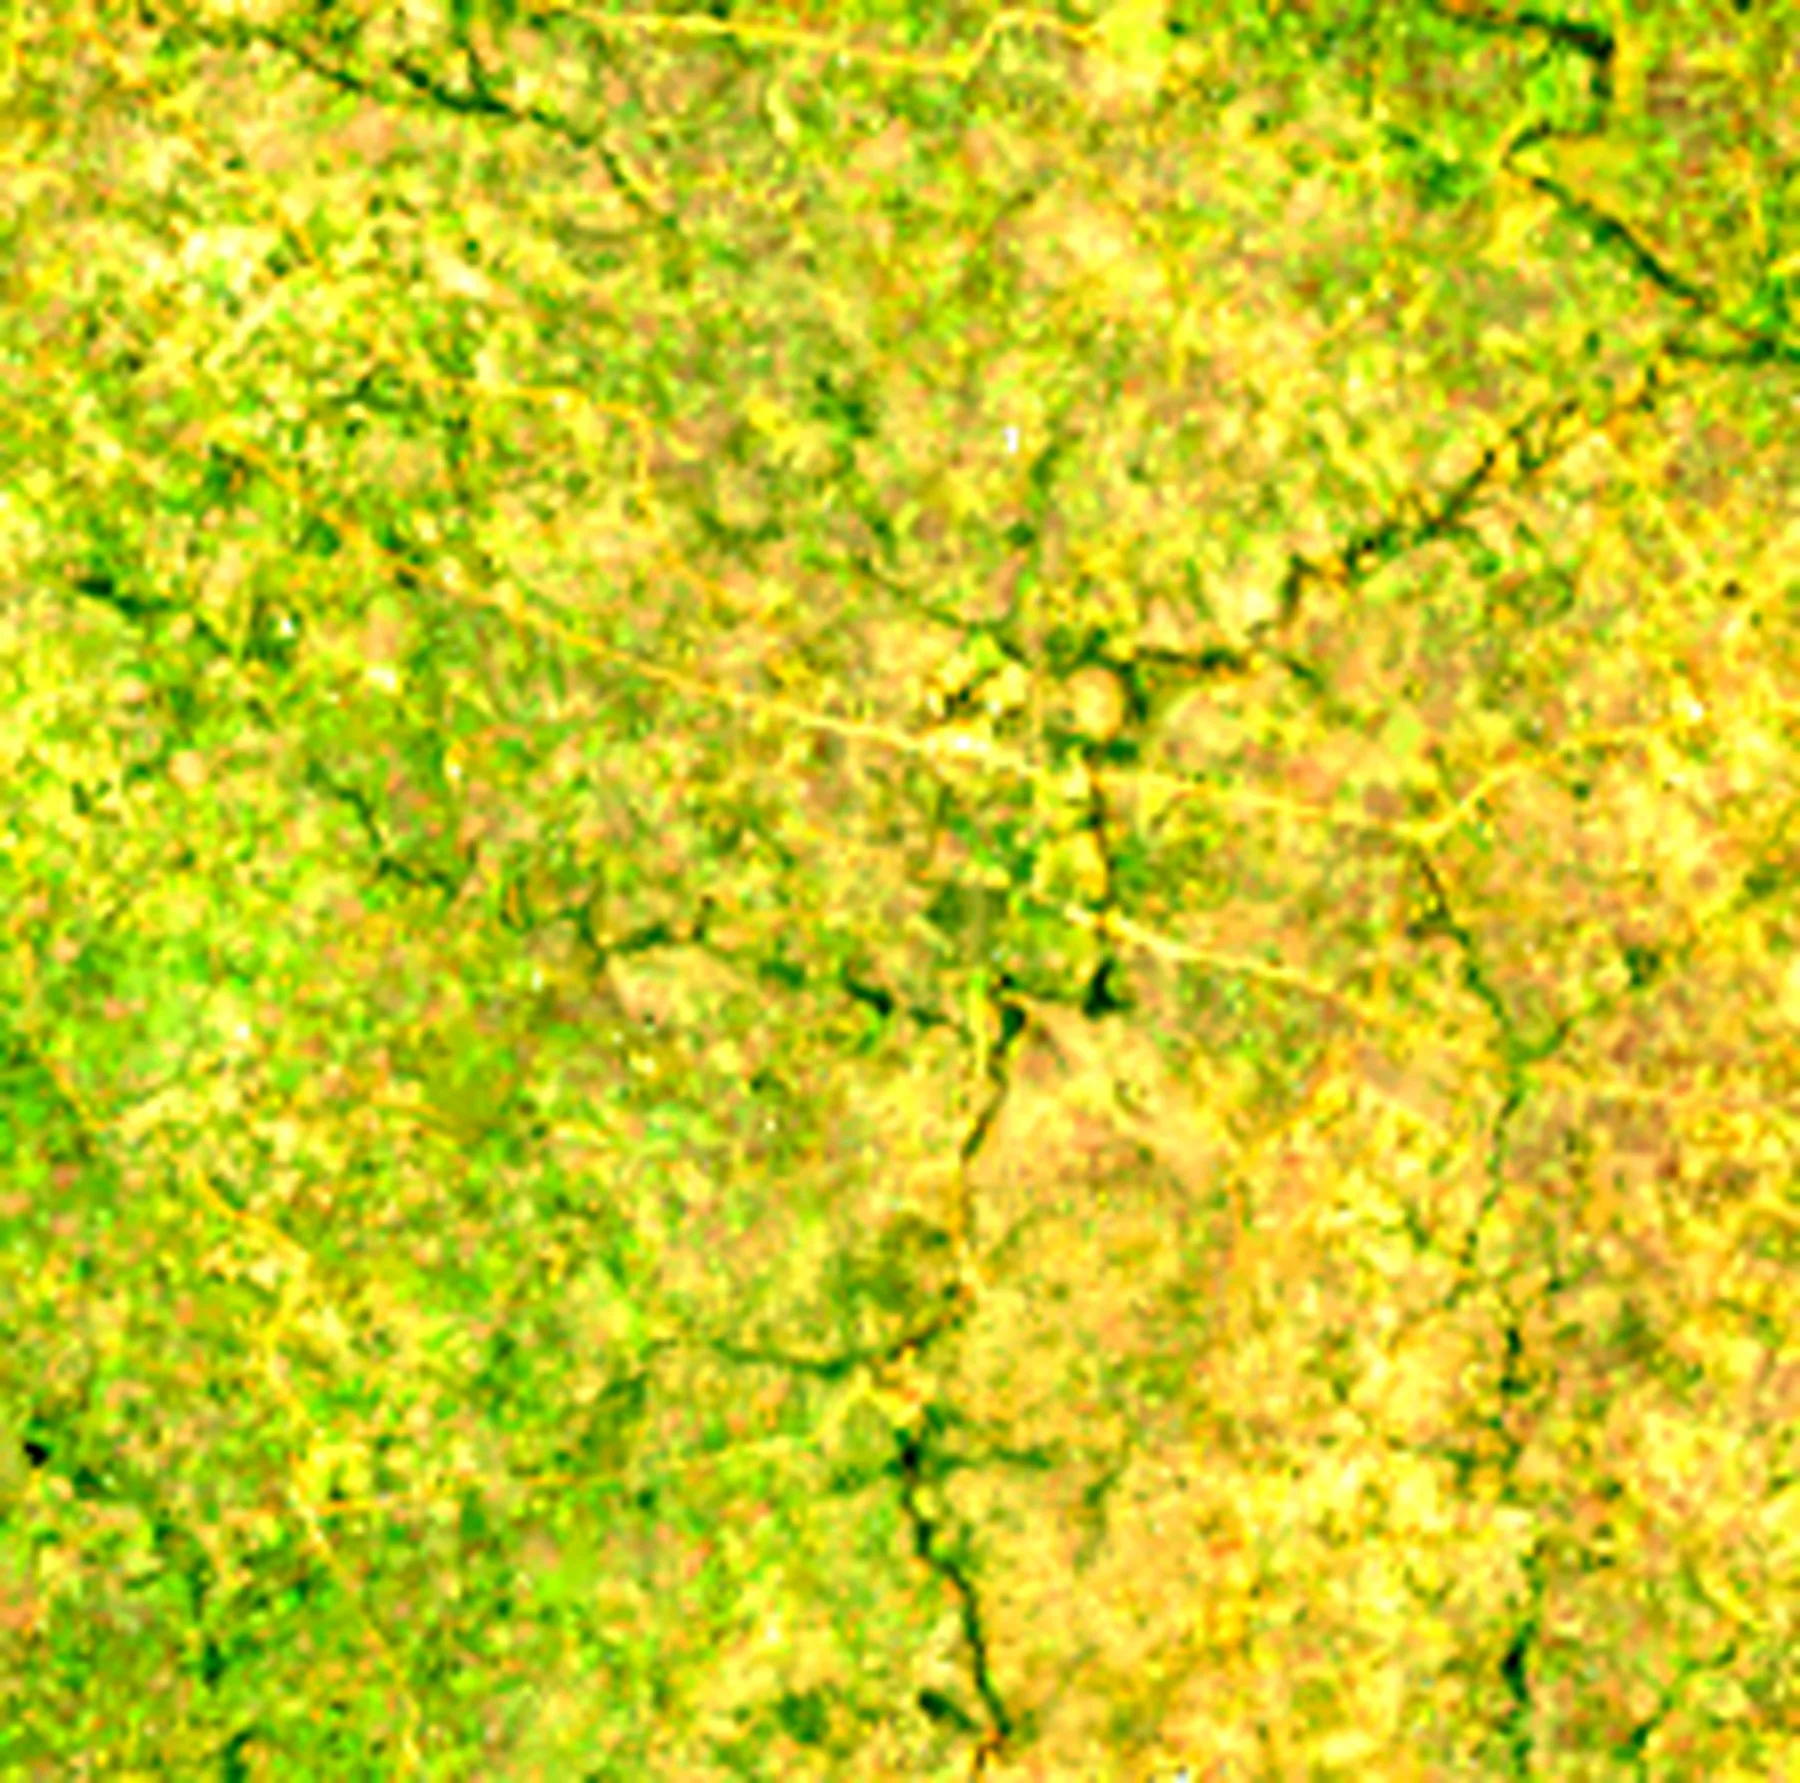
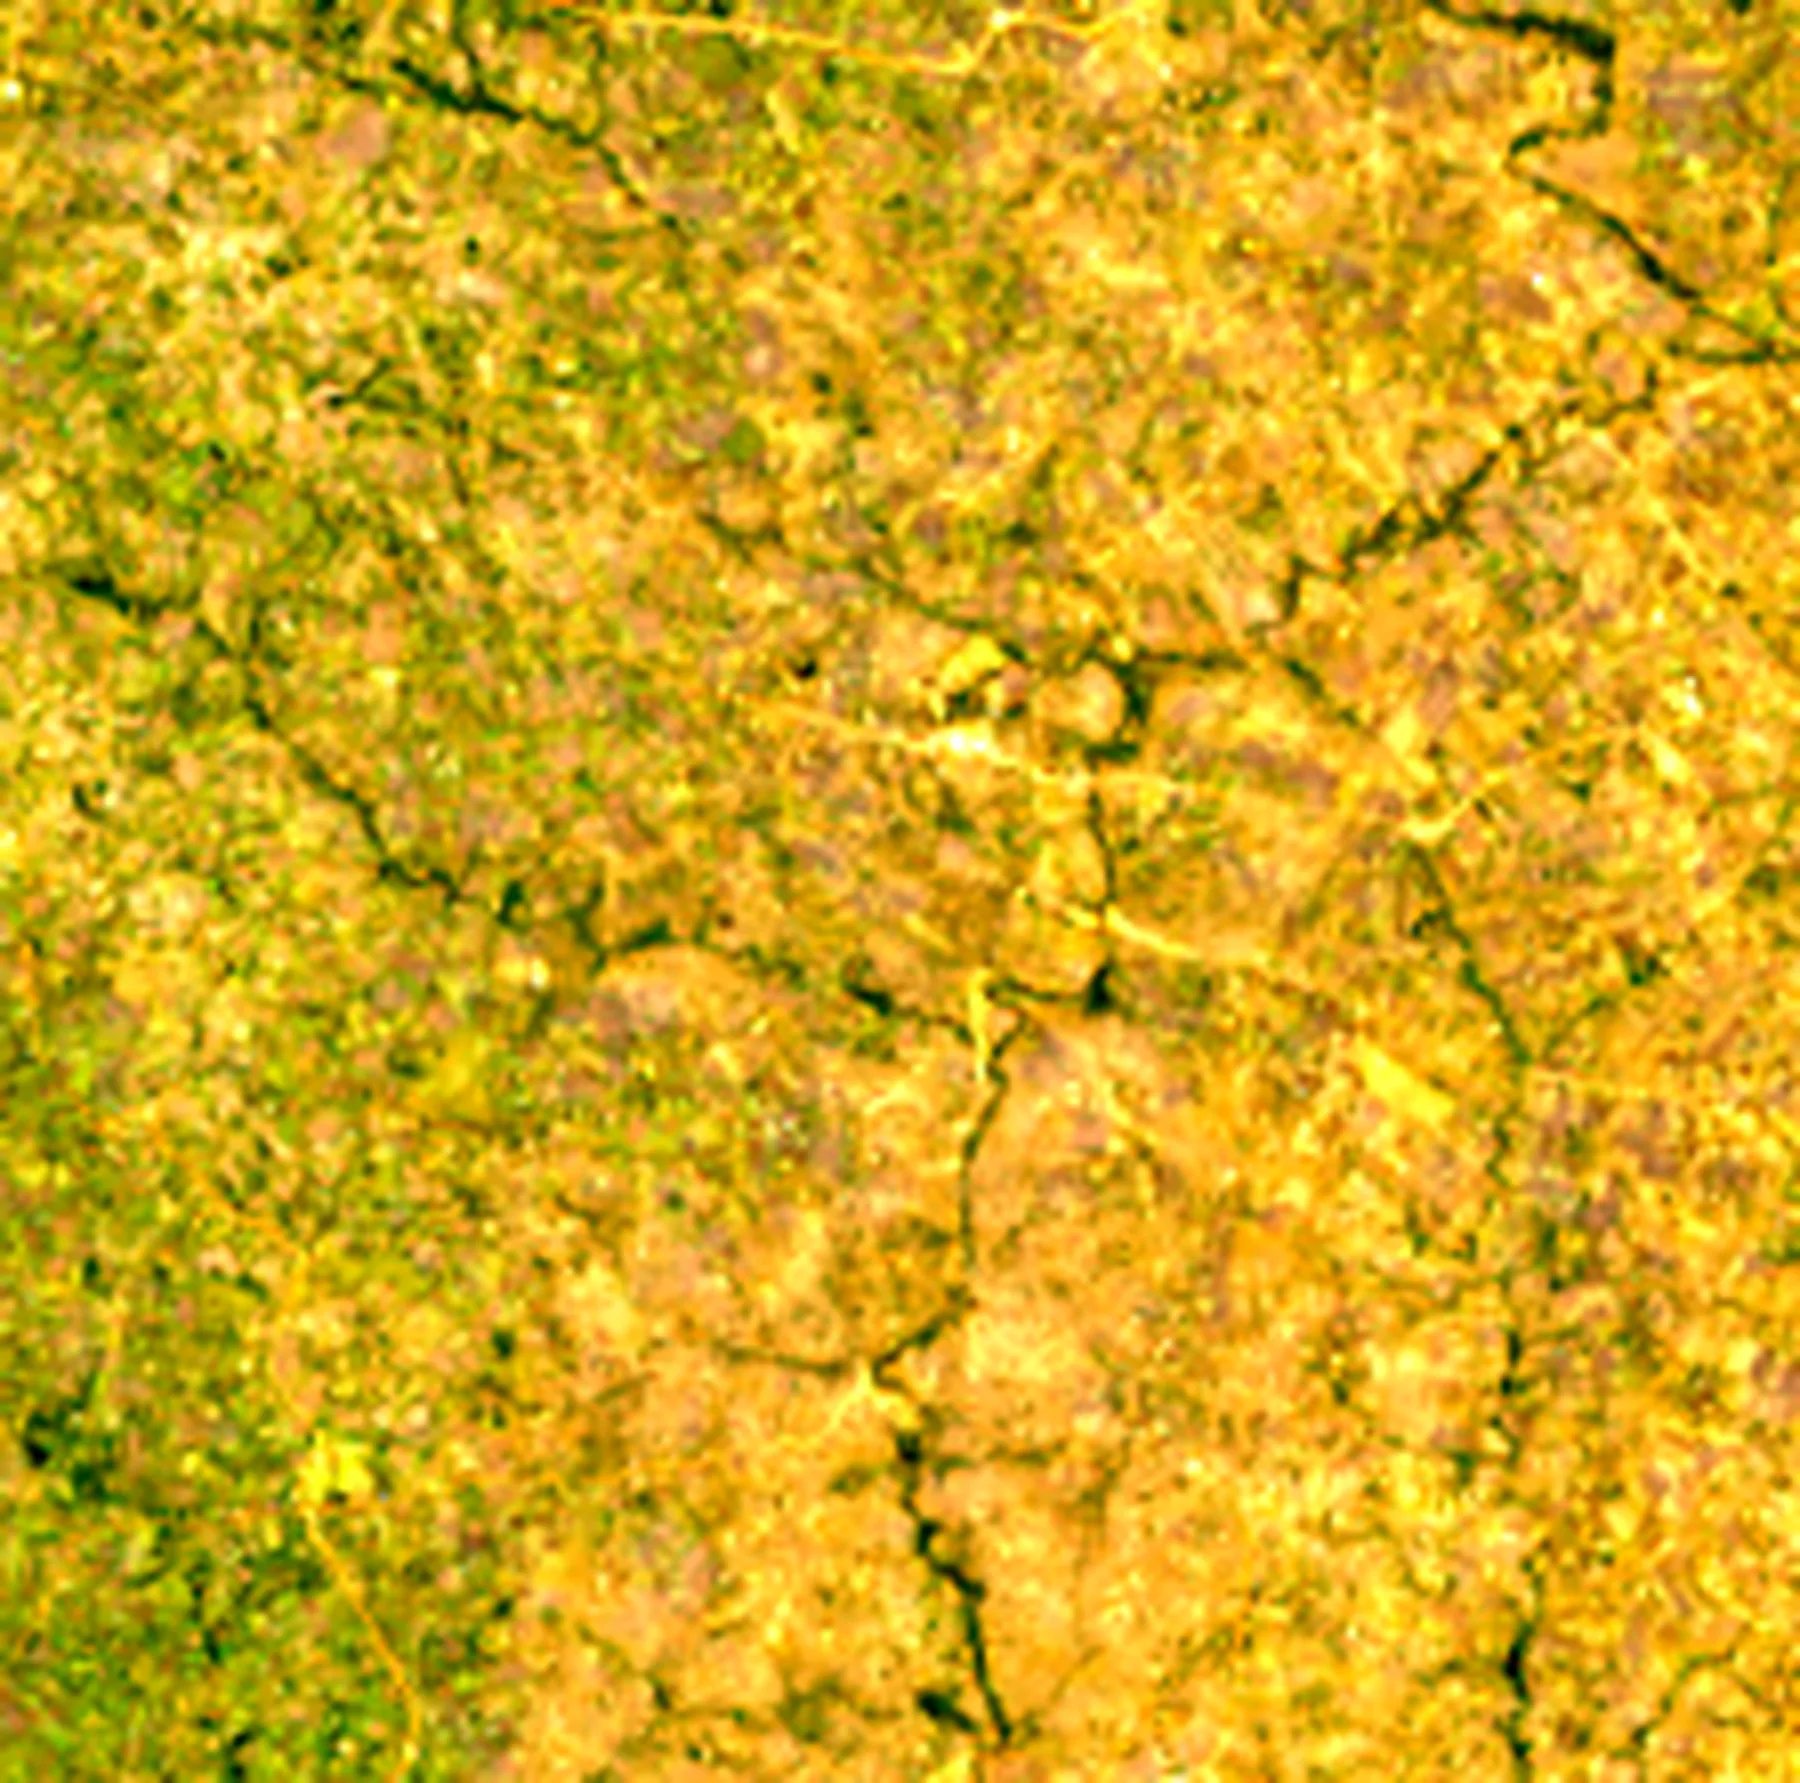
Transmara Forest Block, South-West Mau (demonstration)
SimulatedNarok County, Kenya · approximate demonstration polygon, not a surveyed boundary
Baseline approved by L. Mugwanja (demonstration reviewer) on 2026-01-15 · extraction status approved

The measurement
Monthly mean NDVI across the project boundary, from Landsat Collection 2 Level-2 surface reflectance.
Hollow points fall below 75% valid pixels and are excluded from alerting. Dashed verticals are months with no usable observation — the line breaks rather than guessing across them.
Real measurementThe rule
Robust linear baseline over the approved window, a band of ±1.5 residual sigma, and divergence only after two consecutive periods below it.
A period under 75% pixel coverage can never raise an alert, and breaks the run rather than extending it — we cannot say a site was behind in a month we could not see.
How this is bounded
The model receives only this alert's own evidence, capped at four kilobytes, every fact carrying the id of the record it came from.
An answer citing evidence we never supplied is rejected, as is one that asserts a cause. When that happens the deterministic fallback is used and labelled as such.
A decline in NDVI over 5 consecutive periods (2026-04 to 2026-08) was observed in the Transmara Forest Block, with a seasonally adjusted anomaly of -0.1183. The observed NDVI values were 0.7330, 0.7352, 0.6551, 0.5954, and 0.5244 for the respective periods. The quality of the observations was high, with 1.00 share of pixels surviving cloud, shadow, and saturation masking for most periods, except for 2026-04 which had a quality of 0.41 and was excluded from alerting.
Hypotheses — not conclusions
The decline in NDVI may reflect a change on the ground, such as clearance, grazing, fire, or harvesting, which would be expected if there was a significant disturbance to the vegetation in the project area.
moderate confidence · cites 5 evidence records
The decline in NDVI is consistent with a rainfall-induced stress, as the ERA5 reanalysis data shows a decrease in monthly precipitation from 273.8 mm in 2026-03 to 15.8 mm in 2026-06, which would be expected to impact vegetation health.
moderate confidence · cites 4 evidence records
The decline in NDVI may be due to measurement limitations, such as partial pixel coverage or changes in satellite viewing angles, which would be expected to introduce noise into the NDVI signal.
lower confidence · cites 5 evidence records
Further evidence is needed to distinguish between these hypotheses, such as high-resolution satellite imagery, field observations, or data on land use changes in the project area. Additionally, more detailed information on the rainfall patterns and soil moisture conditions at the site would be helpful in understanding the potential impact of rainfall on vegetation health.
Demonstration field team · carried out 2026-06-15 · follow-up 2026-12-01 · planned
Expected: Vegetation cover stabilises and recovers toward the baseline over two seasons
The mean anomaly moved by -0.0352, which is within the spread of the observations themselves (0.0767). On this evidence the trajectory has not measurably changed.
Hold, and extend the observation window.
No measurable change either way. With this many periods, a real effect of modest size would not yet be visible, so absence of change is not evidence the intervention failed.

Evidence chain
7 records · 7 anchored on CKB testnet.
Each manifest is hashed and committed on chain, carrying the hash of the one before it.
The chain is an application-level structure anchored on CKB. It is not enforced by an on-chain script, and we do not claim it is.
Tamper alters one field of a copy before checking it. Nothing stored is changed — the point is to show the check can fail.
This record is anchored on ckb-testnet. Press Verify to re-hash the stored manifest and compare it with the commitment on chain.